When I look back over sixty years of life, I can tell you that my biggest financial lesson didn’t come from Wall Street, a business school classroom, or a slick stock tip. It came from something far simpler and far more powerful: my savings rate.
In 1999, I was deployed to Bosnia when I opened a Datek online brokerage account. I scraped together $10,000, convinced I’d ride the stock market to wealth. I hunted small-cap stocks, eager for big returns, and even went so far as to borrow on margin. Then came the dot-com crash. My account was decimated. A margin call arrived, demanding I liquidate my portfolio. Instead of accepting the loss, I borrowed against my Ford F-150 to cover it. In the end, I essentially bought that truck twice. That was my first real lesson in investing: you don’t get rich trading stocks.
A year later, in 2001, my grandmother passed away while I was stationed in Germany. To make her funeral, I flew military hops across the Atlantic, then across the country. Along the way, I picked up a copy of Rich Dad, Poor Dad. That book shifted my entire mindset. It taught me that assets put money in your pocket, liabilities take money out, and the rich acquire assets first, only later buying liabilities with the income those assets produce. I realized I’d been thinking like the middle class. I bought liabilities and convinced myself they were assets. But if I wanted to be rich, or even just financially free, I needed to flip that script.
From that moment, I began thinking of money as three lines: Line 1: Income. Line 2: Expenses. The difference between line 1 (Income) and line 2 (Expenses) equals the amount going into your “Freedom Fund”. Line 3: Represents the Investment Income result from your “Freedom Fund” account.
The first rule: Line 2 must always be smaller than Line 1. In practice, that meant at least
10% of my gross income had to go straight into my “Freedom Fund”. No exceptions.
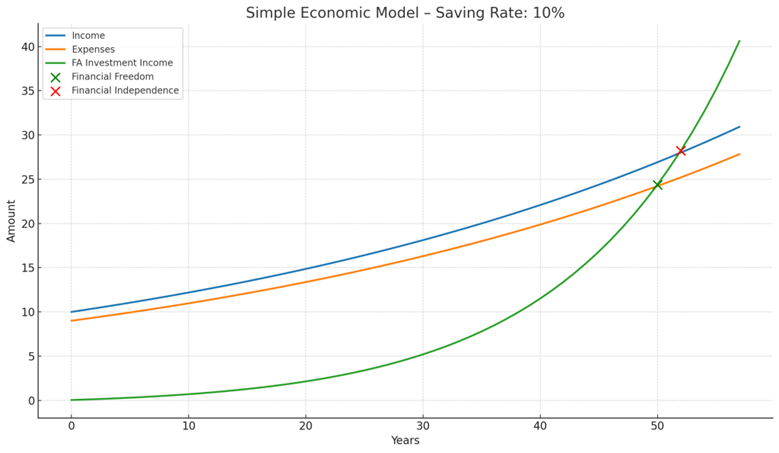
At first, I set my savings rate at 10%, it didn’t take long for me to realize it wasn’t going to be enough. As you can see with the above visualization. It would take approximately 50 years to achieve Financial Freedom (assumptions for the visualization: 10% savings rate, 2% inflation, Freedom Rate grows at a 7.18% rate (doubles every 10 years) and a 4% savings withdrawal rate).
Based on the information calculated by my Simple Economic Model, I decided I needed to up my Savings Rate. My goal was to achieve between 20-30%. Each time I got a raise, or paid off a car loan, I funneled that money into savings instead of spending it. Over time, my savings rate rose to 20–30%, and on deployments, sometimes more than 50%. That habit, more than any stock trade, was the turning point of my financial life.
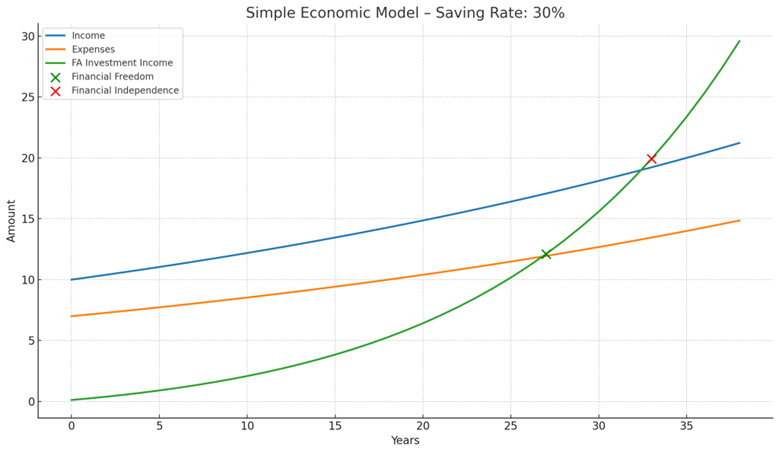
As you can see with the above visualization, a savings rate of 30% takes 27 years to reach Financial Freedom and 33 years to reach Financial Independence.
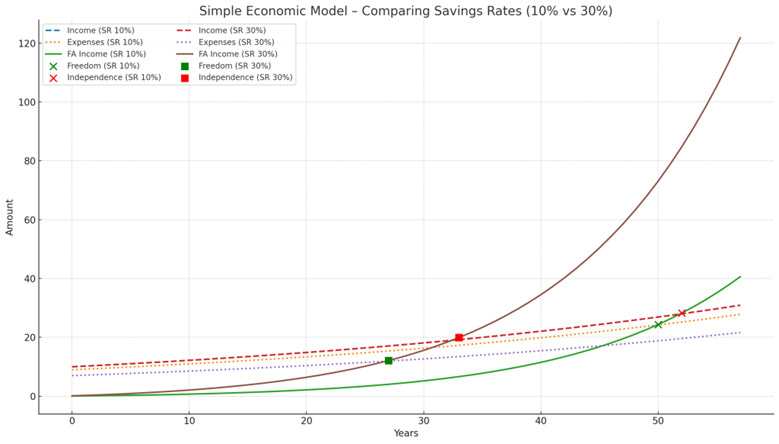
Now let’s compare the two graphs. Saver A invests 10% of income while Saver B invests 30% of income. You can see in the graph below the dramatic difference in the length of time it takes to reach either Financial Freedom or Financial Independence.
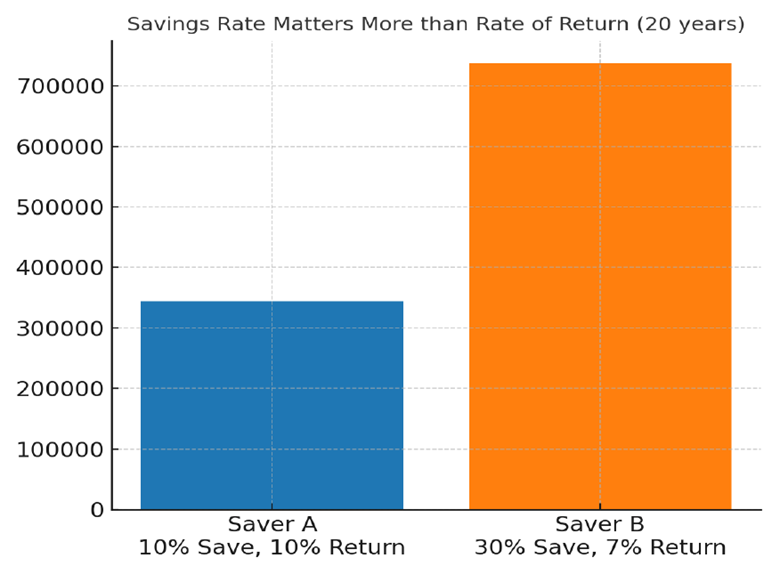
Here’s the thing most people miss: your savings rate is far more important than your investment return. Consider this example: Saver A invests 10% of income at 10% return. Saver B invests 30% of income at 7% return. After 20 years, Saver B comes out ahead. Why? Because the amount invested (savings rate) outweighs the rate of return.
Compounding is like gravity. It doesn’t matter if you believe in it; it still works. And the longer you let it pull on your money, the faster it accelerates. Take $10,000 invested at 7% annually. After 40 years, it grows to nearly $150,000.
Your savings rate doesn’t just build wealth, it determines when you’ll be free. At a 10% savings rate, financial freedom takes more than 50 years. At 30%, it can happen in under 30. At 50%, just 17 years. This is why I tell people: the savings rate is the most powerful tool you control.
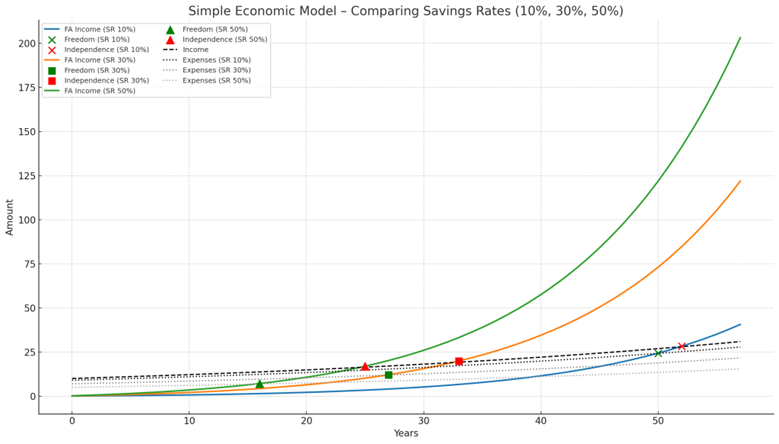
Here’s the Simple Economic Model comparing savings rates of 10%, 30%, and 50% (with 2% growth in income & expenses).
- 10% Savings Rate (Income 10, Expenses 9):
- Financial Freedom → Year 50
- Financial Independence → Year 52
- 30% Savings Rate (Income 10, Expenses 7):
- Financial Freedom → Year 27
- Financial Independence → Year 33
- 50% Savings Rate (Income 10, Expenses 5):
- Financial Freedom → Year 16
- Financial Independence → Year 25
This shows how dramatically higher savings rates accelerate both milestones.
When the Thrift Savings Plan (TSP) opened to military personnel in the mid-2000s, I set up a system: 1) Max out TSP, 2) Max out IRA, 3) Funnel any remainder into a taxable brokerage account.
Over time, I learned an important lesson: the accounts I never raided (my TSP and IRA) grew into the backbone of my financial freedom. My taxable brokerage account, however, became a source of temptation. I dipped into it for cars, and even bought a condo in cash.
At age 60, I can say with certainty: I reached financial freedom because I consistently saved 20–30% of my income, invested in low-cost index funds, and left those accounts untouched.
Looking back, my biggest financial mistake was believing I could outsmart the market. My biggest financial win was committing to a high savings rate and sticking with it. That’s the lesson I wish I had learned earlier, and the one I hope to pass on now: Your savings rate is the most important financial decision you will ever make.
We created a Financial Freedom/Independence Calculator (Coach Holdren’s Simple Economic Model (SEM)) where you can test out your own path to Financial Freedom or Independence.
You will find the calculator under the “S.E.M. Calculator” tab or click this Link: S.E.M. Calculator – Simpli-FI.money.