Coach Holdren’s Simple Economic Model: The Chalkboard Play
If you were in my locker room and asked for money advice, I’d grab a marker and draw a simple diagram, the same play I teach every time.
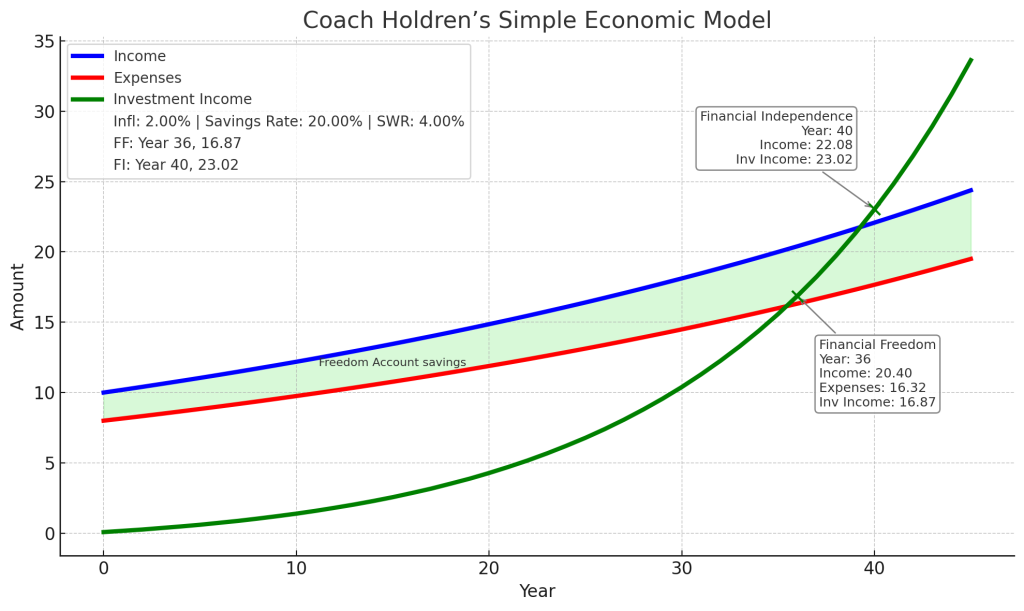
First, I draw two simple lines, one above the other, both slightly angled upward.
The top line I label Income.
The second line I label Expenses.
Then I shade the space between them and say, “This green zone is your Freedom Account, the money you invest.” That shaded area is created by your savings rate. Bigger gap = more fuel for the engine.
Next, I draw a third line that starts at zero, creeps along slowly, and then about two-thirds across the diagram it begins to curl upward like a perfect free kick. That’s Investment Income, what your Freedom Account throws off at a 4% safe withdrawal rate.
Now the two critical scoring moments:
- When the Investment Income line crosses your Expenses line, you’ve hit Financial Freedom. Your portfolio can cover your lifestyle. You can stop working if you want to.
- When that same line crosses your Income line, you’ve reached Financial Independence. Work is entirely optional; the scoreboard is yours.
That’s it. Honestly, that’s all a person really needs to know about money.
So how do we run this play every day, without overthinking it?
- Automate the process. Pay yourself first. Route your savings to the Freedom Account automatically.
- Invest in low-cost index funds. Keep fees low, stay diversified, and let time do the heavy lifting.
- Your savings rate sets the pace. The higher your savings rate, the faster those lines separate and the quicker your Investment Income catches up.
- Compound interest does the work for you. Your job is to keep feeding the Freedom Account; compounding will take the shot and put points on the board.
- Spend the rest on your priorities—and avoid long-term debt. Keep bad habits off the field and the rest runs on autopilot.
It really doesn’t need to be more complicated than this. The advantage of Coach Holdren’s Simple Economic Model is that it gives you a clear timeline. Plug in your numbers, choose your savings rate (that’s fully under your control), and you’ll see how long it will take to hit:
- Financial Freedom (Investment Income = Expenses), and
- Financial Independence (Investment Income = Income).
Just like training: pick the plan, run the drills, and let the clock do its job. Keep widening that green zone, and the win will come.
Let’s take a look at Coach Holdren’s Simple Economic Model graph posted on the top of this page. Income is set at 10 and expenses are set at 8. That means 2 is going each period into your Freedom Account. Or a 20% savings rate. Over time that Freedom Account grows at a rate of 7.18% (or doubles every 10 years). Your Freedom Account Income is assumed to be 4% of the money that is sitting your Freedom Account. The model assumes a 2% inflation rate.
The model then identifies each benchmark:
- Financial Freedom (Investment Income = Expenses): Year 36 with 16.87.
- Financial Independence (Investment Income = Income): Year 40 with 23.02.
You can run your own numbers using Coach Holdren’s Simple Economic Model, Savings rate calculator. Go to the tools/ calculator tab and plug in your numbers. This will give you an idea of how long your journey will take.
You will find the calculator under the “S.E.M. Calculator” tab or click this Link: S.E.M. Calculator – Simpli-FI.money.