Does the Real Market Behave Like the Farmer’s Compounding Garden?
In the first two articles of this series, we explored compounding through metaphor and framework.
In Part I, the Farmer’s Compounding Garden showed us what compounding feels like over a lifetime: painfully slow at first, then quietly unstoppable for those who stay long enough.
In Part II, we translated that story into financial principles: decades matter more than years, doubling matters more than dollars, and patience is the true price of compounding.
Now we arrive at the unavoidable question:
Does the real market actually behave like the Farmer’s Compounding Garden?
Or is the garden simply a comforting story that collapses under real-world data?
This article is not about optimizing returns. It is about stress-testing the idea of compounding against actual market reality and understanding why compounding often feels broken even when it is working.
For readers who want to examine the full methodology, tables, and calculations used in this analysis, a complete walkthrough is available at the below link:
One Share per Year Methodology & Data Tables with Coach Holdren’s notes
Turning a Metaphor Into a Market Proxy
The Farmer’s Compounding Garden ignores price. It counts seeds, plants, and time. Growth happens when mature plants produce new seeds, not because the farmer works harder.
To compare that model to real investing, we needed a reasonable proxy for “the market”; something broad, investable, and long-lived. We selected two long-running, broad-based exchange-traded funds (ETFs) that closely track the U.S. S&P 500 and the Dow Jones Industrial Average. We chose SPY (S&P 500) and DIA (Dow Jones Industrial Average) as our two proxy ETFs.
This was not an attempt at precision forecasting. It was an attempt at pattern recognition.
The goal was simple:
Do long-term market returns resemble the growth arc of the Compounding Garden closely enough to reward patience over decades?
Below is a graph comparing the growth of the Farmer’s Compounding Garden (orange line) to DIA (green line), and SPY (dotted blue line) from 31 December 1996 to 31 December 2025 (30 years).
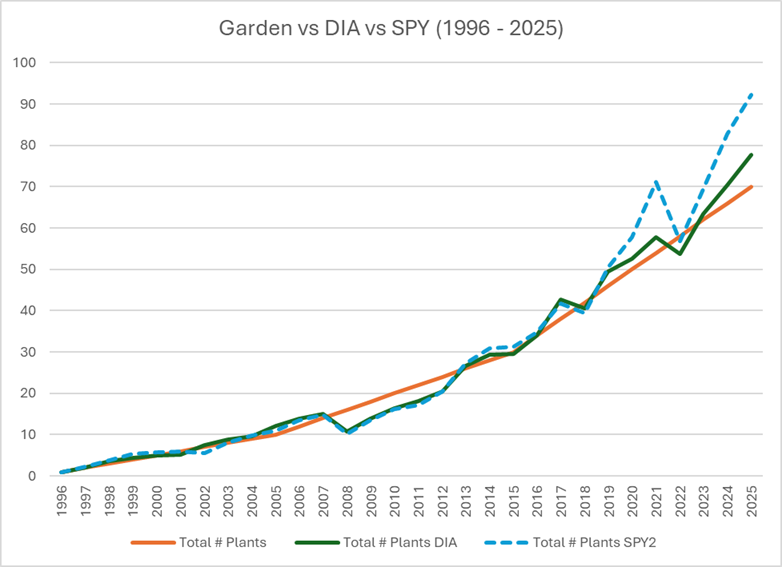
Notice in the above graph, there are significant periods of time where the market underperforms the Farmer’s Compounding Garden. Between the periods of 2008 and 2013, when an investor is living in the market, it will appear compounding doesn’t work. This is where it is very tempting for an investor to quit or give up.
Below is a table comparing the cumulative returns of the Farmer’s Compounding Garden to the Market (DIA and SPY) returns. You’ll see the Farmer’s Compounding Garden outperforms the market in period 15. The Farmer’s Compounding Garden also outperforms DIA in period 20, but SPY squeaks out a win. Numbers in bold text identify when the market wins, or win the Farmer’s Compounding Garden wins.
| Period | Year | Total # Plants Garden | Total # Plants DIA | Total # Plants SPY | Garden Cumul. Return | DIA Cumul. Return | SPY Cumul. Return |
| 1 | 1996 | 1 | 1 | 1 | 0.0000% | 0.0000% | 0.0000% |
| 5 | 2000 | 5 | 5.0294 | 5.7310 | 0.0000% | 0.2934% | 6.8279% |
| 10 | 2005 | 10 | 12.2203 | 11.0043 | 0.0000% | 4.3808% | 2.1086% |
| 15 | 2010 | 20 | 16.3404 | 16.1981 | 3.9841% | 1.2107% | 1.0881% |
| 20 | 2015 | 30 | 29.4766 | 31.2595 | 4.0715% | 3.9018% | 4.4659% |
| 25 | 2020 | 50 | 52.6492 | 57.7719 | 5.3362% | 5.7065% | 6.3653% |
| 30 | 2025 | 70 | 77.7766 | 92.1909 | 5.3029% | 5.9070% | 6.8646% |
A Deliberately Unnatural Method
To make the comparison conceptually clean, we imposed a strict and somewhat artificial rule:
Buy exactly one share per year (no more, no less) regardless of price.
After 30 years, the investor owns 30 shares.
Those shares are then divided into two components:
- The basis, representing the farmer’s effort (the seeds he planted).
- The gain or loss, representing the garden’s contribution (what time produced).
This mirrors the farmer planting one seed per year, but it is not how real investors typically invest.
That limitation is intentional.
This method strips away optimization and exposes something more important:
the actual experience of compounding when price volatility is allowed to speak loudly.
What the Market Reveals Over Three Decades
Over a full 30-year horizon, the market broadly does what the garden does and more.
Measured this way, both market proxies:
- Track the general growth arc of the Compounding Garden.
- Periodically lag it for long stretches.
- Eventually catch up.
- And over the full period, tend to outperform.
That result should not surprise anyone familiar with long-term equity returns.
What should surprise people is how uneven the journey is.
There are extended periods, sometimes a decade or more, where the market lags the garden. There are periods where it surges ahead. And there is no reliable way, year by year, to know which phase you are living through while you are in it.
In other words:
The market rewards patience, but it does not reward comfort.
Why Compounding Feels Broken While It’s Working
The Farmer’s Compounding Garden grows smoothly by design. Markets do not.
This comparison reveals a critical truth:
Compounding is mathematically elegant, but psychologically hostile.
There are long stretches where the “garden’s contribution” is negative. Years where time appears to subtract rather than multiply. Periods where discipline feels indistinguishable from foolishness.
And yet, over decades, the pattern reasserts itself.
This is why so many investors fail to benefit from compounding. Not because compounding does not exist, but because the human nervous system is poorly suited to endure the path required to access it.
Individual Seed Returns vs. System Returns
One of the most important insights from this analysis is also one of the most misunderstood.
In the Compounding Garden:
- Each mature “seed” effectively grows at a steady rate over time.
- But the garden itself does not grow at that rate in the early decades.
The system-level return starts low, fluctuates, and only gradually approaches its long-term rate as more plants mature and begin producing.
The market behaves the same way.
This explains a common frustration:
- Investors hear long-term return averages.
- They compare those numbers to their early-year experience.
- And conclude something must be wrong.
Nothing is wrong.
They are simply measuring the system before the system is mature.
While the individual plant’s growth rate is to double every 10 years (or grow at a 7.17735%) the overall garden’s growth rate is much lower in the earlier years and gradually climbs towards 7% as the garden produces more seeds than the farmer is planting. Below is a table showing the Garden’s implied return to yield the growth of the garden for that particular year.
| Period | Year | Total # Plants | Garden Cum Return |
| 1 | 1996 | 1 | |
| 10 | 2005 | 10 | 0.0000% |
| 15 | 2010 | 20 | 3.9841% |
| 20 | 2015 | 30 | 4.0715% |
| 25 | 2020 | 50 | 5.3362% |
| 30 | 2025 | 70 | 5.3029% |
| 35 | 2030 | 110 | 5.9391% |
| 40 | 2035 | 150 | 5.8754% |
| 45 | 2040 | 230 | 6.2669% |
| 50 | 2045 | 310 | 6.1968% |
Notice the Garden’s return steadily increases each decade. But even after 50 years, the cumulative return is just under 6.2% even though each individual seed’s growth rate is to double every 10 years (an implied 7.17735% rate).
The Honest Limitation of This Approach
Buying one share per year is not how most people invest. Real investors contribute dollars, not units. Contributions usually scale with income, not price. Real investors tend to contribute a set amount of dollars in a given year or a certain percentage of the earnings.
This method of buying only one share per year regardless of price:
- Exaggerates price volatility.
- Exposes sequencing risk more sharply.
- Lacks the natural stabilizing effect of buying more shares when prices are lower.
But that is precisely why it is useful here.
It reveals the emotional terrain of compounding without cushioning it.
It shows why staying invested feels unnatural, even when the long-term math is favorable.
And it explains why so many people abandon compounding before it has a chance to reveal itself.
The Takeaway
The real market does not contradict the Farmer’s Compounding Garden.
It confirms it with a warning.
Compounding works.
But it works unevenly.
It works late.
And it demands endurance through long periods where results feel disconnected from effort.
The garden was never wrong.
The timeline was.
In the next article (Part IV), we will address the natural follow-up question:
If this is the curve, how should a real investor interact with it?
Specifically, we will examine how dollar-cost averaging (investing consistent dollars rather than fixed shares) changes the experience of compounding, turns volatility into an ally, and aligns human behavior more closely with the compound curve.
Because staying invested is essential, but how you stay invested matters more than most people realize.