The Standard 80–20 Portfolio Mix
At the heart of my coaching philosophy for investing is a formation inspired by Warren Buffett’s own guidance: always keep at least 20 percent of a portfolio in U.S. Treasuries. Buffett has long reminded us that while equities are the great compounding engine of wealth, Treasuries provide the ballast that keeps an investor upright through every storm. In my version of this approach, 80 percent of the portfolio is committed to stocks; the forwards and wingers driving growth, scoring the goals that ultimately build wealth. The other 20 percent is allocated to short-term Treasury bills, the goalkeeper of the lineup. These bills do not aim to score, but they preserve capital and steady the portfolio when the counterattack comes.
A crucial element of the system is rebalancing. At least once or twice a year, the portfolio is brought back to its 80–20 alignment. This means trimming back the offense when it has run too far ahead and reinforcing the defense when it has been eroded, or conversely, adding to equities after a setback and allowing T-Bills to serve as dry powder. This disciplined rebalancing is the equivalent of keeping the players in position—ensuring the strikers don’t abandon their formation and the goalkeeper never drifts upfield. The result is a team that stays balanced, aggressive enough to win, but always protected against catastrophe.
The Goalkeeper Portfolio: Why 20% in T-Bills Protects the Whole Team
This post is inspired by a question that came up in the ChooseFI community. “I understand the choosefi world isn’t a fan of bonds, but I found several high paying dividend stocks based off the sp500. Currently paying out 12%. Even if the stock market halves you should still get 6%. Which is more than any bonds.“
The above ChooseFI question is similar to the one I often here which comes up often: “If the dividend yield on an S&P 500 dividend fund is at least as high as Treasury bills, why not use the dividend fund for the defensive sleeve of the portfolio?”
It is an understandable challenge. Dividend funds produce income, and unlike Treasury bills, they also carry the potential for capital appreciation. Why, then, would we “waste” twenty percent of the portfolio on securities that feel boring, inert, even lifeless?
The answer, as any good coach will tell you, is that a soccer team without a goalkeeper can play brilliant football until the counterattack comes. Then the goals pour in. The goalkeeper’s job is not to score. It is to protect. And in a portfolio, short-term Treasury bills are the goalkeeper. They don’t lose value, they become more certain as they approach maturity, and they provide ballast when the rest of the squad falters. Dividend stocks, on the other hand, are still midfielders. They may defend better than pure growth names, but when the market crashes, they crash as well.
To test this principle, let us conduct a thought experiment across history.
Proxies and Assumptions
Because the modern ETFs VTI (broad market) and SPYI (dividend income) do not extend back very far in time, we use established historical proxies.
- Broad Market (VTI proxy): the S&P 500 Total Return Index (including dividends).
- Dividend Stocks (SPYI proxy): high-dividend stock portfolios, such as the Dow Jones High Dividend or Fama-French dividend series.
- Treasury Bills: 3-month U.S. Treasury bill returns, which capture the “cash-equivalent” role.
Two portfolio lineups are tested:
- Option 1 (Classic Mix): 80 percent S&P 500 Total Return, 20 percent T-Bills.
- Option 2 (Dividend Mix): 80 percent S&P 500 Total Return, 20 percent high-dividend stocks.
Each portfolio begins with $100, is rebalanced annually, and is run through four distinct historical “seasons”:
- 1990–1999: a booming bull market.
- 1970–1979: stagflation and flat real returns.
- 1929–1939: the Great Depression.
- 2000–2010: the “lost decade” with two bear markets.
The 1990s: The Offensive Surge
The 1990s were a time of extraordinary growth in equities, led by technology and globalization. In such an environment, offense wins the match. Option 1, with a goalkeeper, ended the decade at $430. Option 2, all offense with dividends, finished at $518. The clear winner for this 10-year time frame is Option 2 (Dividend Portfolio).
Figure 1. Portfolio Growth, 1990s
(Chart shows the dividend mix pulling ahead in a straight upward climb. The goalkeeper was untested.)
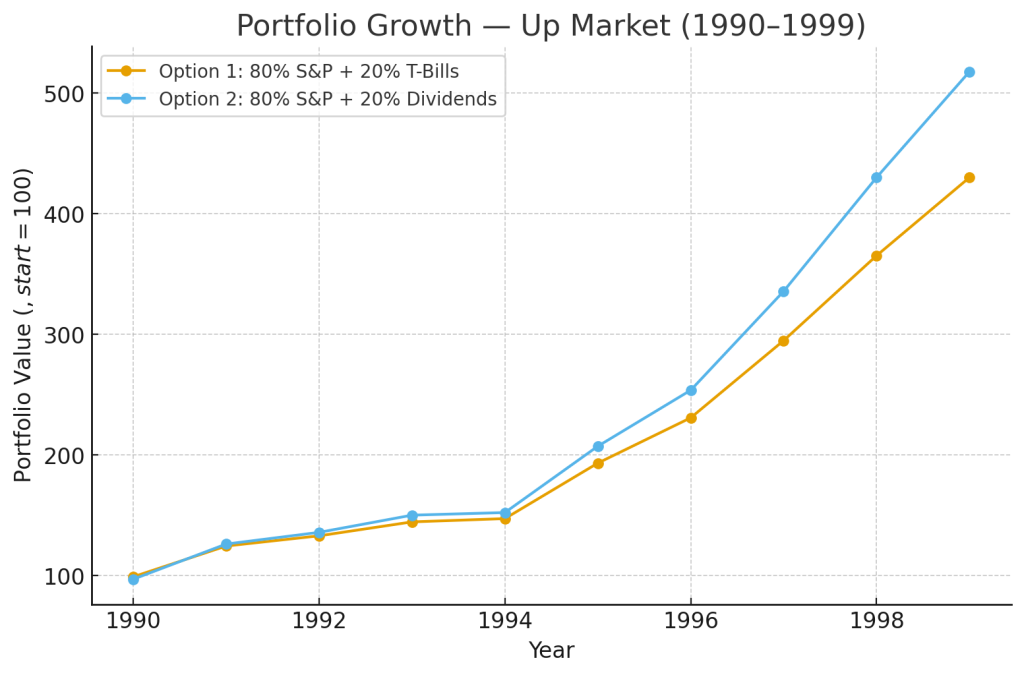
Table 1. Portfolio Values, 1990–1999
| Year | Option 1 (80% S&P + 20% T-Bills) | Option 2 (80% S&P + 20% Dividends) |
|---|---|---|
| 1990 | 99.14 | 97.12 |
| 1991 | 124.62 | 126.26 |
| 1992 | 133.07 | 135.95 |
| 1993 | 144.62 | 150.20 |
| 1994 | 147.34 | 152.36 |
| 1995 | 193.34 | 207.34 |
| 1996 | 230.92 | 253.78 |
| 1997 | 294.93 | 335.80 |
| 1998 | 365.30 | 430.09 |
| 1999 | 430.11 | 517.83 |
The 1970s: The Midfield Battle
The 1970s presented a different test. Inflation surged, oil shocks rattled markets, and real equity returns were nearly flat. In this slog of a decade, neither strategy ran away from the other. Option 1 finished at $189, while Option 2 ended at $187. There is no clear winner in this 10-year time frame. While Option 1 (T-Bill Portfolio) comes out slightly ahead, it isn’t by much.
Figure 2. Portfolio Growth, 1970s
(Chart shows a grinding sideways battle. T-Bills kept Option 1 slightly steadier.)
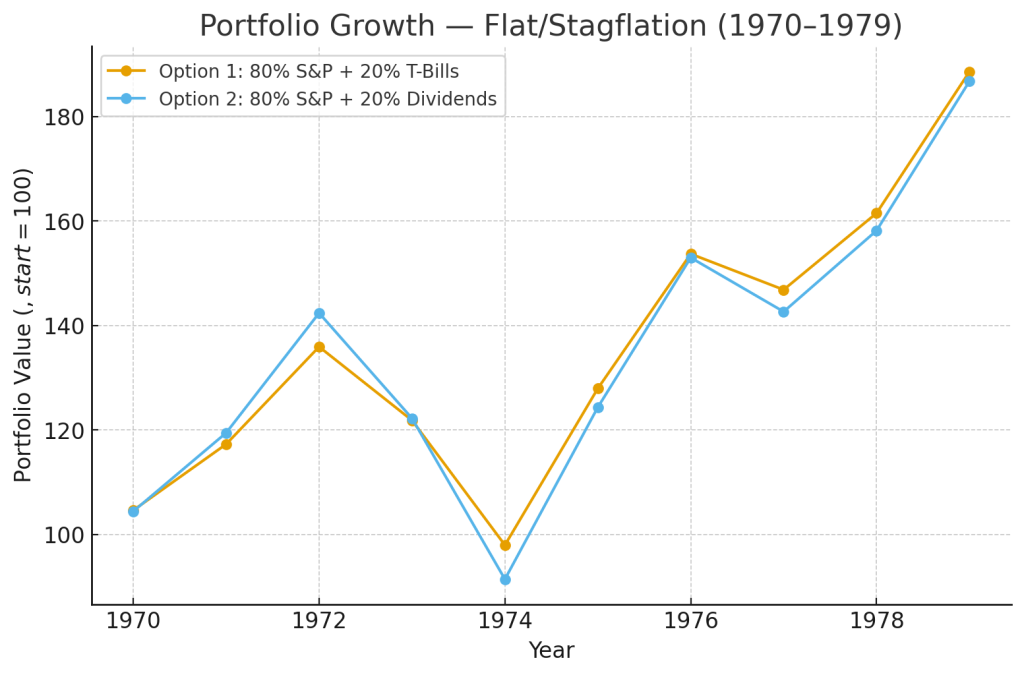
Table 2. Portfolio Values, 1970–1979
| Year | Option 1 (80% S&P + 20% T-Bills) | Option 2 (80% S&P + 20% Dividends) |
|---|---|---|
| 1970 | 104.60 | 104.40 |
| 1971 | 117.26 | 119.43 |
| 1972 | 135.90 | 142.36 |
| 1973 | 121.82 | 122.21 |
| 1974 | 97.94 | 91.41 |
| 1975 | 127.92 | 124.32 |
| 1976 | 153.68 | 152.96 |
| 1977 | 146.82 | 142.62 |
| 1978 | 161.48 | 158.14 |
| 1979 | 188.57 | 186.73 |
The 1930s: The Collapse
The Great Depression revealed the importance of defense. Equities collapsed by nearly 80 percent from 1929 to 1932. Both portfolios suffered heavy losses, but Option 1 ended at $105, while Option 2 managed only $95. More critically, Option 1’s maximum drawdown was about −60 percent, compared to −68 percent for Option 2. The clear winner for this 10-year time frame is Option 1 (T-Bills Portfolio).
Figure 3. Portfolio Growth, 1930s
(Chart shows devastating early losses; Option 1 recovers more strongly, cushioned by T-Bills.)
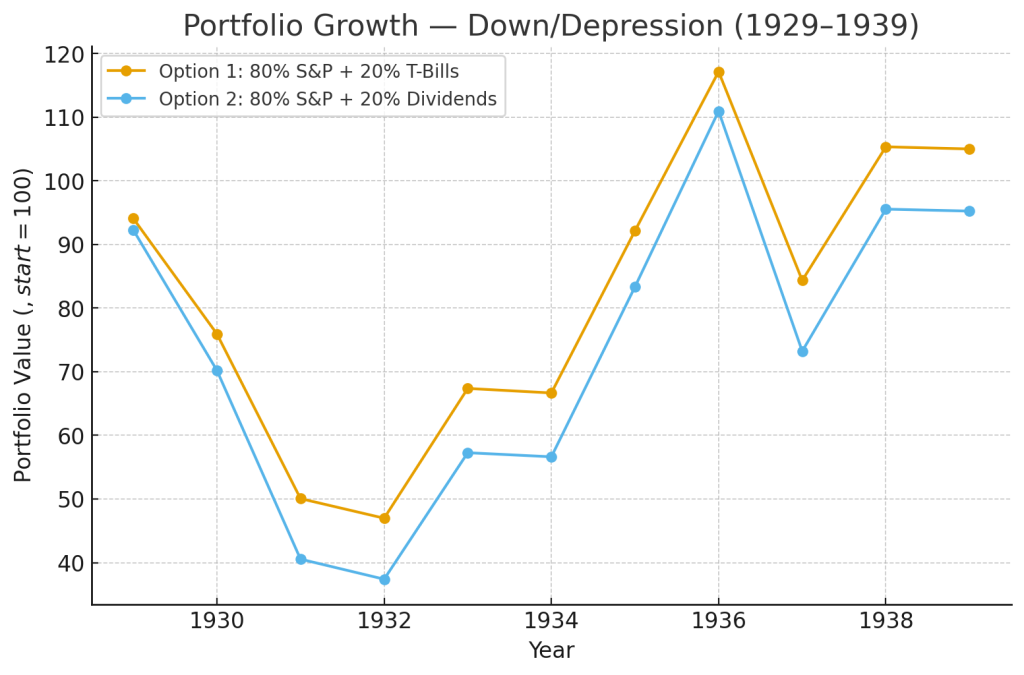
Table 3. Portfolio Values, 1929–1939
| Year | Option 1 (80% S&P + 20% T-Bills) | Option 2 (80% S&P + 20% Dividends) |
|---|---|---|
| 1929 | 94.08 | 92.28 |
| 1930 | 75.94 | 70.21 |
| 1931 | 50.06 | 40.55 |
| 1932 | 46.98 | 37.40 |
| 1933 | 67.37 | 57.27 |
| 1934 | 66.66 | 56.63 |
| 1935 | 92.14 | 83.34 |
| 1936 | 117.14 | 110.94 |
| 1937 | 84.34 | 73.22 |
| 1938 | 105.33 | 95.54 |
| 1939 | 104.99 | 95.23 |
The 2000s: The Lost Decade
The 2000s brought two bear markets—the dot-com collapse and the global financial crisis—separated by a mid-decade rally. Option 1 finished at $114; Option 2 at $113. The critical distinction was drawdown. Option 1 fell a maximum of −29 percent, Option 2 a maximum of −36 percent. For investors, that difference in pain determines whether you hold or fold. Once again, there is no clear winner in this 10-year time frame. While Option 1 (T-Bill Portfolio) comes out slightly ahead, it isn’t by much.
Figure 4. Portfolio Growth, 2000s
(Chart shows two steep drops; Option 1 cushions the fall each time.)
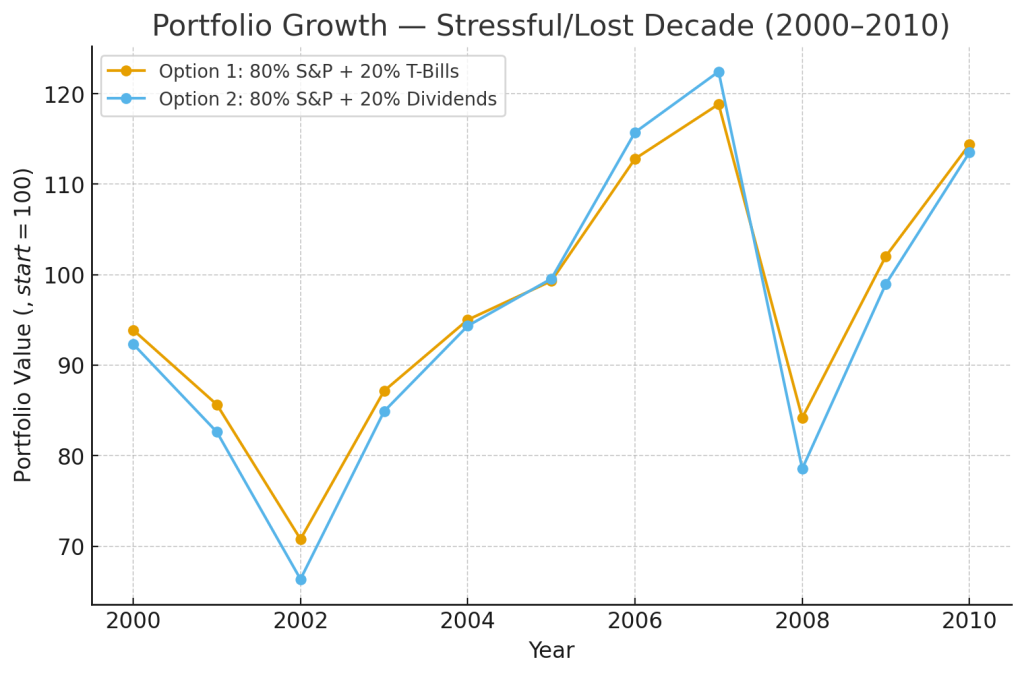
Table 4. Portfolio Values, 2000–2010
| Year | Option 1 (80% S&P + 20% T-Bills) | Option 2 (80% S&P + 20% Dividends) |
|---|---|---|
| 2000 | 93.88 | 92.32 |
| 2001 | 85.64 | 82.61 |
| 2002 | 70.77 | 66.35 |
| 2003 | 87.16 | 84.90 |
| 2004 | 95.01 | 94.34 |
| 2005 | 99.30 | 99.55 |
| 2006 | 112.80 | 115.72 |
| 2007 | 118.83 | 122.43 |
| 2008 | 84.18 | 78.55 |
| 2009 | 102.04 | 98.97 |
| 2010 | 114.39 | 113.50 |
Summary Across All Eras
Table 5. Summary Metrics
| Era | Option 1 End ($) | Option 2 End ($) | Option 1 CAGR | Option 2 CAGR | Option 1 MaxDD | Option 2 MaxDD |
|---|---|---|---|---|---|---|
| 1990s Up | 430.11 | 517.83 | 10.95% | 13.33% | −3.8% | −5.4% |
| 1970s Flat | 188.57 | 186.73 | 6.57% | 6.52% | −29.3% | −36.0% |
| 1930s Down | 104.99 | 95.23 | 0.49% | −0.48% | −59.9% | −68.0% |
| 2000s Stress | 114.39 | 113.50 | 1.81% | 1.74% | −29.2% | −35.8% |
Conclusion
The experiment demonstrates a consistent truth: dividend stocks are still equities. They can provide income and sometimes outperform in up markets, but they cannot serve as a substitute for genuine safety. In booms, the dividend mix excels. In flat or stressful markets, the two approaches perform similarly. But in crises, only T-Bills consistently reduce drawdowns and preserve capital.
A dividend stock fund is a useful midfielder. It adds strength, sometimes even scoring on its own. But it cannot be the goalkeeper. The 20 percent in Treasury bills may look uninspired during easy wins, but when the other side launches a counterattack, you’ll be grateful to have someone standing between you and the net.
This is why the Coach Holdren’s portfolio mix recommendation follows Warren Buffet’s advice of maintaining a minimum of 20% of your portfolio invested in US short term treasuries. Not because it wins every game with style, but because it keeps you in the tournament long enough to win the season.
Building Lasting Habits
Now that you have a clear understanding of the “80-20 Mix” strategy from our recent post — how allocating 80 % to long-term growth investments and 20 % to stability can serve as a strong foundation for your portfolio — it’s time to shift from what you allocate to how you live and act. The portfolio mix matters, but it works best when it is supported by the right habits.
That is why we created The Core Financial Habits series. It is designed to help you build the four foundational behaviors that build wealth: consistent saving, intentional spending, strategic investing, and ongoing money management. If you are ready to move beyond information and start building the habits that make financial freedom inevitable, begin with Part 1 of the series here: Developing the Core Financial Habits – Introduction.
Coach Holdren’s S.E.M. Calculator
Once those habits are in place, you can take the next step by using Coach Holdren’s S.E.M. Calculator to project your personal timeline to financial freedom. By entering your savings rate, earnings, and investment assumptions, the calculator shows you how the small, consistent actions you take today compound into long-term results. It reveals how your daily decisions shape your overall trajectory and helps you see, with real numbers, how soon you can achieve financial freedom or full independence.