Two Paths to Financial Independence:
As a long-time listener and supporter of the ChooseFI community, let me begin with appreciation. The ChooseFI podcast and website have been nothing short of life-changing for thousands of people around the world. Their framework makes the intimidating concept of Financial Independence (FI) both accessible and actionable.
I’ve followed ChooseFI for years and agree with much of their philosophy. At the same time, through trial and error, we developed our own framework called the Simpli-FI.money’s Simple Economic Model. It’s not in opposition to the ChooseFI approach rather, it’s a complementary lens, forged out of lived experience.
The ChooseFI Definition of Financial Independence (FI)
The ChooseFI model provides a simple benchmark:
- FI = 25 × annual expenses (based on the 4% Safe Withdrawal Rate from the Trinity Study)
- Conservative FI = 35 × annual expenses (≈ 3% withdrawal rate)
So, if your annual expenses are $50,000:
- FI Number (25× rule): $1.25M
- Conservative FI Number (35× rule): $1.75M
Key Feature of ChooseFI
To use this method, you must determine your annual expenses. That usually means tracking spending for a few months, then projecting an annual number.
This expense-awareness is a strength of the ChooseFI approach: it challenges you to live intentionally, evaluate how you spend, and embrace frugality as a tool to accelerate FI.
Simpli-FI.money’s Simple Economic Model
My model flips the sequence. Instead of starting with expenses, it starts with your Savings Rate.
- Line 1: Income – your paycheck or earned income.
- Line 2: Expenses – everything you spend (implicitly defined).
- Line 3: Freedom Account Income – the passive income generated from your “Freedom Account.”
Here’s how it works:
- Decide up front what percentage of your income (say 20–30%) goes into your Freedom Account.
- Automate contributions so the money moves before you can spend it.
- Invest the Freedom Account into low-cost index funds.
- Never touch it until it funds your life.
The difference (Income − Savings) is assumed to be Expenses. You don’t have to track every dollar because even if you save or underspend, eventually that money gets spent one way or another.
Milestones in this Model
- Financial Freedom: Line 3 (Freedom Account Income) ≥ Line 2 (Expenses).
- Financial Independence: Line 3 (Freedom Account Income) ≥ Line 1 (Income).
The Subtle but Distinct Difference
- ChooseFI: Expenses-first. You track and measure every dollar, because your FI number depends directly on knowing your annual expenses. Encourages frugality and intentionality.
- Simpli-FI.money: Savings-first. You define your savings rate and automate it. As long as it’s high enough, you don’t have to obsess over expenses. Encourages peace of mind—spend the rest however you like, you’ve already “paid yourself first.”
Both approaches get you to FI, but the psychological experience is different.
- ChooseFI sharpens discipline by shining a spotlight on spending.
- Simpli-FI.money’s model removes guilt, because once your savings rate is locked in, you’re free to make spending mistakes and still come out ahead.
Visualizing the Journey
Example 1: $80k Income, 37.5% Savings Rate
Couple A wants to save $2,500 per month (or $30,000 per year). They automate the process by having $30k taken out of their paycheck and automatically deposited to their Freedom Account(s) (This could be a combination of: 401k, TSP, 403b, IRA, and/or taxable brokerage accounts).
Their combined earnings are $80,000 per year. Making their savings rate 30k/80k = 37.5%.
The chart below illustrates how the three lines interact over time in Simpli-FI.money’s Simple Economic Model.
- Line 1 (Income) = $80k
- Savings = $30k (37.5%) → which gets automatically deposited to their Freedom Accounts
- Line 2 (Expenses) = $50k (80k-30k )
- Line 3 (Freedom Account Income) = grows until it crosses first Expenses (Freedom) and later Income (Independence).
- Financial Freedom = ChooseFI Number (25× Expenses = $1.25M portfolio = $50k withdrawals).
- Financial Independence = $2.0M or $80k withdrawals. Compared to the Conservative FI Number of 35x Expenses = $1.75M.
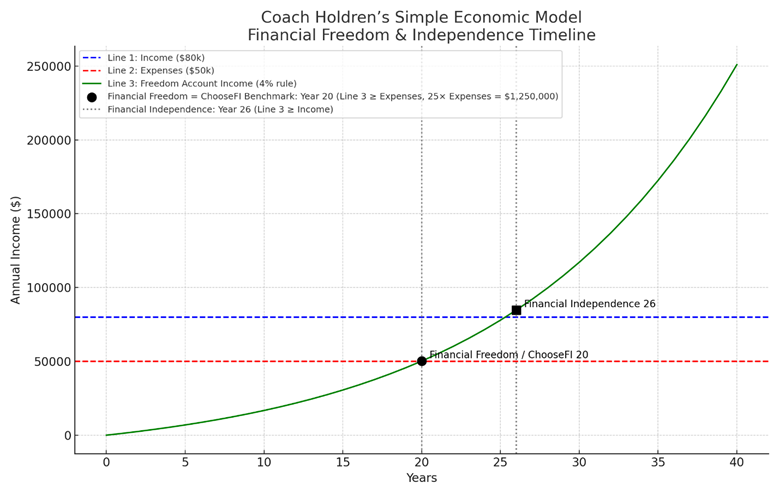
Figure 1: Income: $80k, Savings: $30k (Savings Rate: 37.5%), Expenses: $50k
Example 2: $100k Income, 25% Savings Rate
Let’s look at another example: Couple B earns $100,000 per year and decides to achieve a 25% savings rate going into their Freedom Account, which they will not touch until it funds their lifestyle.
- Line 1: Income = $100,000
- Savings = $25,000 (Savings rate of 25%) → Freedom Account
- Line 2: Expenses = $75,000 (what’s left)
- Freedom Account: $25,000/year in low-cost index funds at ~7.18% growth
- Line 3 (Freedom Account Income) = grows until it crosses first Expenses (Freedom) and later Income (Independence).
- Financial Freedom = ChooseFI Number (25× Expenses = $1.875M portfolio = $75k withdrawals).
- Financial Independence = $2.5M or $100k withdrawals. Compared to the Conservative FI Number of 35x Expenses = $2.625M.
Step 1: Financial Freedom
- Target: Line 3 ≥ Line 2 = $75,000.
- Portfolio required = $75,000 ÷ 4% = $1.875M.
- At $25,000/year contributions, compounding gets you there in ~26–30 years.
Step 2: Financial Independence
- Target: Line 3 ≥ Line 1 = $100,000.
- Portfolio required = $100,000 ÷ 4% = $2.5M.
- Same contributions reach this milestone in ~30–35 years.
Depending on the lifestyle Couple B chooses, their “exit point” is the range between Financial Freedom and Financial Independence: $1.875M – $2.5M.
Comparing Simpli-FI.money’s Simple Economic Model to ChooseFI’s Financial Number.
- ChooseFI would first ask: What are your annual expenses?
- Here it’s $75,000, so the 25× rule = $1.875M.
- That’s exactly the same as the Financial Freedom milestone in Simpli-FI.money’s model.
- The more conservative ChooseFI number 35x rule = $2.625M.
- Simpli-FI.money’s Financial Independence milestone is achieved earlier at $2.5M.
- Depending on your specific situation, the ChooseFI conservative 35x rule could be more or less than Simpli-FI.money’s Financial Independence milestone. Whereas, the ChooseFI’s 25x rule number will always equal Simpli-FI.money’s Financial Freedom milestone.
The difference:
- ChooseFI makes you track your $75,000 expenses carefully.
- Simpli-FI.money’s Simple Economic Model assumes the $25,000 savings rate upfront, and expenses are simply “whatever is left.”
Both apply similar math—but the focus and behavior patterns are different.
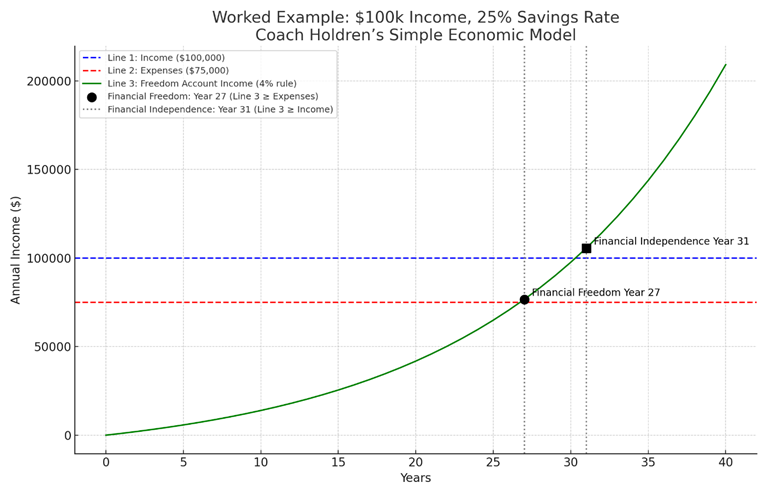
Figure 2: Income: $100k, Savings: $25k (Savings Rate: 25%), Expenses: $75k
Comparing the Two Approaches
| Aspect | ChooseFI | Simpli-FI.money’s Model |
| FI Benchmark | 25–35× annual expenses | Line 3 ≥ Line 2 (Freedom) → Line 3 ≥ Line 1 (Independence) |
| Core Focus | Track expenses first, then set FI number | Define savings rate first, automate Freedom Account |
| Key Habit | Frugality and intentional spending | Paying yourself first, automating savings |
| Psychological Edge | Awareness: challenges you to scrutinize spending | Peace: frees you from obsessing over spending |
| Withdrawal Rule | 4% of portfolio | 4% of Freedom Account (assumed growth ~7.18%) |
Summary of the two approaches
The ChooseFI model shines because it gives you a clear target: a number to aim for and the discipline of expense-tracking. Simpli-FI.money’s Simple Economic Model shines because it simplifies the process: automate a high savings rate, invest it, and stop worrying about the rest.
In practice, you don’t have to pick one over the other. Use ChooseFI’s 25× rule as your benchmark, while adopting the Simple Economic Model to build the habit of paying yourself first. Because in the end, both paths lead to the same destination: a life where money works for you, not the other way around.
Simpli-FI.money includes a calculator that builds Simpli-FI.money’s Simple Economic Model. This calculator also allows you to insert an inflation rate to both your Income and Expenses. You can find the calculator by clicking on the Tools/ Calculator tab above.
We created a Financial Freedom/Independence Calculator (Simpli-FI.money’s Simple Economic Model (SEM)) where you can test out your own path to Financial Freedom or Independence.
You will find the calculator under the “S.E.M. Calculator” tab or click this Link: S.E.M. Calculator – Simpli-FI.money.
A Third Lens: The “Five Doubles” or 32× Approach (Upper-Bound FI)
There is a third way to think about Financial Independence that sits conceptually above both the ChooseFI 25× rule and Simpli-FI.money’s Simple Economic Model. Rather than beginning with income or savings rate, this approach returns to the most fundamental building block of your life: your annual living expenses. From that baseline, the goal is not 25× expenses, but five full doublings of that number or 32× annual expenses. This is equivalent to planning around a 3.125% withdrawal rate, which is more conservative than the standard 4% rule.
The concept of this idea is discussed in Coach Holdren’s Thought Experiment: On Compounding Five Part Series. The concept of reaching five doubles is examined in Part II of the On Compounding series.
Why five doubles? Because each doubling represents a meaningful psychological and mathematical shift in your relationship with money. After your first double, you are no longer starting from zero. After your second, your portfolio begins to feel real. By your third, investment income becomes noticeable. By your fourth, compounding is clearly doing heavy lifting. By your fifth double, your portfolio has moved from “safety net” to “institution.” At that point, your wealth is not merely sufficient; it is structurally resilient.
Using this framework, your target becomes simple to express:
- If your annual living expenses are $50,000, five doubles means a portfolio of $1.6 million (32 × $50,000).
- If your annual living expenses are $75,000, five doubles means $2.4 million (32 × $75,000).
- If your annual living expenses are $100,000, five doubles means $3.2 million (32 × $100,000).
This 32× target can be thought of as an upper bound for “comfortable independence.” It does not assume perfection in market returns, and it does not require heroic savings behavior in retirement. Instead, it builds in a margin of safety against inflation shocks, sequence-of-returns risk, and unexpected life events. With a 3.125% withdrawal rate, your portfolio has far more room to absorb downturns while still supporting your lifestyle.
How does this compare to the other two models?
- The ChooseFI 25× rule defines the minimum viable threshold of independence based on historical success rates of a 4% withdrawal rate. It is clear, simple, and powerful — but it leaves little cushion if markets underperform or if your spending rises.
- Simpli-FI.money’s Simple Economic Model reframes the journey around savings behavior rather than expense tracking. It defines two milestones — Financial Freedom (Withdrawal rate ≥ Expenses) and Financial Independence (Withdrawal rate ≥ Income) — and makes automation and habit formation the center of the process.
- The 32× Five Doubles approach sits above both as a conservative ceiling. It does not replace them; it brackets them. If 25× is “enough,” then 32× is “comfortably enough.”
In practice, many investors experience a natural progression across all three lenses over time. Early in the journey, the ChooseFI 25× number provides a clear target. In the middle years, the Simple Economic Model keeps them disciplined by focusing on savings rate and automation. As their portfolio grows, the Five Doubles framework offers a higher bar for those who want maximum financial peace of mind rather than minimum sufficiency.
Viewed together, the three approaches form a continuum:
- 25× expenses (4%) = baseline independence.
- Simpli-FI.money’s SEM model = behaviorally optimized path to freedom and independence.
- 32× expenses (3.125%) = upper-bound security and resilience.
None of these is “right” or “wrong.” They simply answer different psychological questions. ChooseFI asks, “What is the least I need?” The Simple Economic Model asks, “What habits should I build?” The Five Doubles approach asks, “How secure do I want to be?”
For many families, the most powerful answer is to use all three simultaneously: aim first for 25×, build your life around a strong savings rate, and treat 32× as your stretch goal; the point where work becomes optional in the deepest possible sense.